THE METHOD

Enrollment Engineering. A conversion strategy for clinical trial enrollment.

We bring modeling, behavioral science, operational design and live control together to improve patient recruitment, enrollment and retention. Each discipline produces practical outputs that guide decisions across your study.

Free Enrollment Assessment

Free 1-hour enrollment assessment, delivered by one of our principals

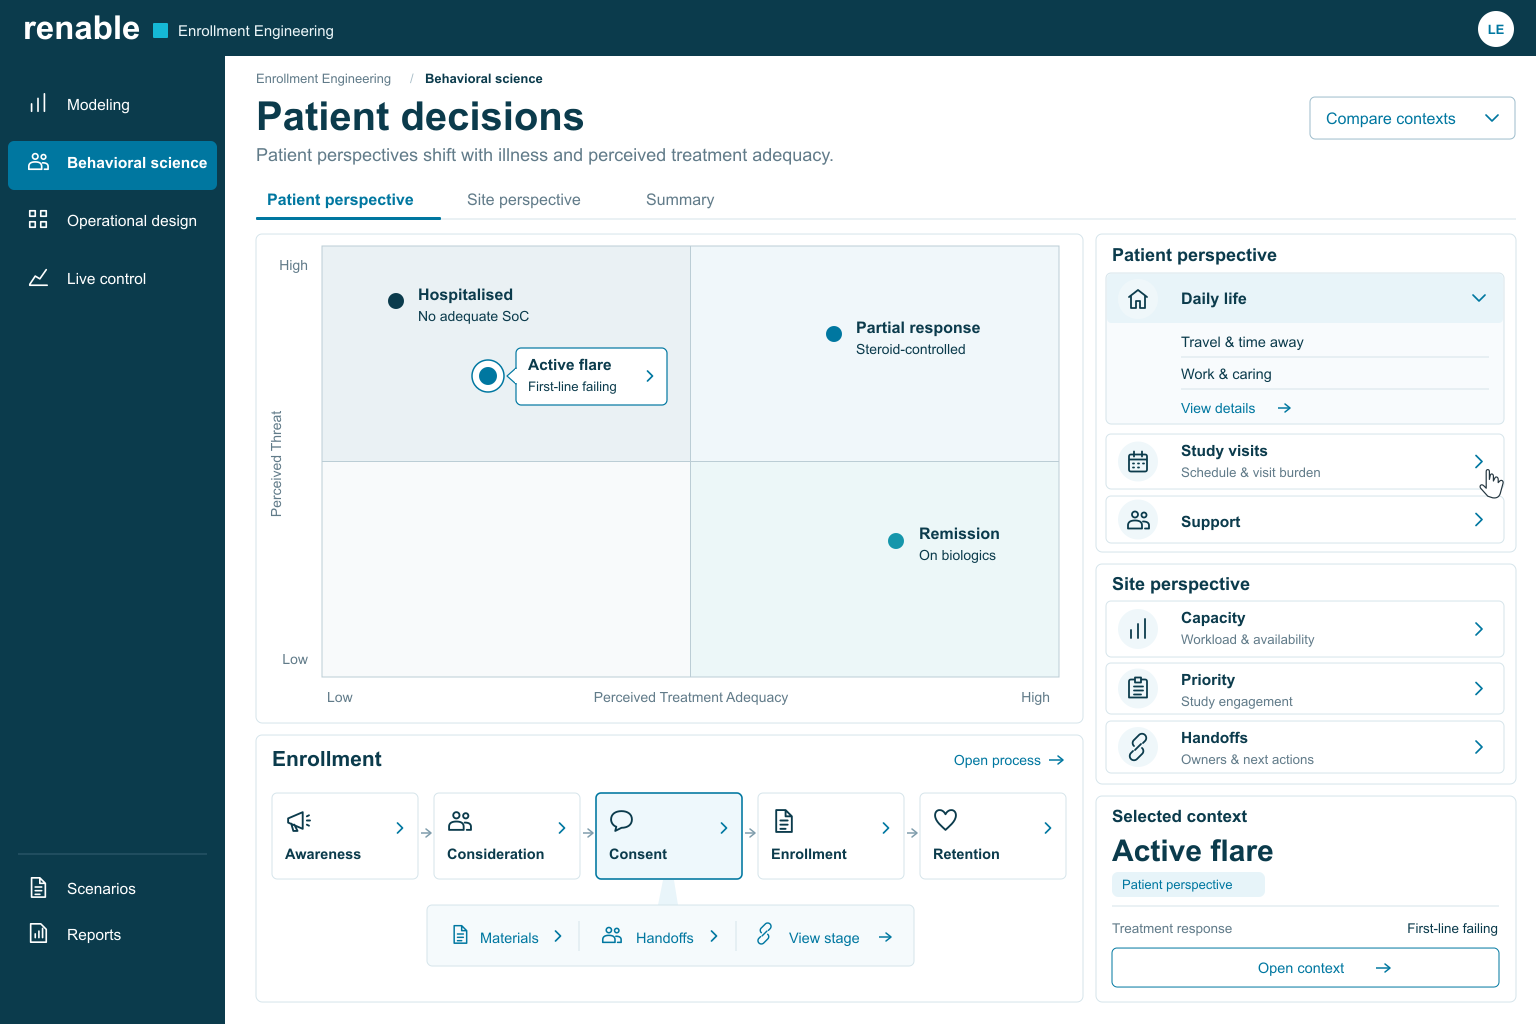
Renable behavioral science system. Patient contexts are mapped by perceived threat and treatment adequacy. Patient and site perspectives connect with awareness, consideration, consent, enrollment and retention.
200+studies enrolled
80%+last patient in inside the original window
50years between the two principals
85,000leads and 25,000 clinic appointments a year, through one site

Enrollment is a funnel. You are paying to fill the top.

Every decision about the study lands somewhere in that funnel. And a funnel does not add. It multiplies. What a decision costs at one stage, it costs again at every stage below.

WHY IT GOES WRONG

The assumptions behind the forecast

We analyzed three anonymized proposals from large global CROs for the same study. Identical protocol, identical patient population.

MeasureRangeVariance
Patients per site per month0.18 to 2.5114x
Screen-failure assumption15% to 60%4x
Sites proposed2 to 3819x
Enrollment period30 to 60 months2x

None of the three is necessarily wrong. But the sponsor chose one without seeing the reasoning, then built the timeline, the budget and the site list on it. A rate that can vary fourteen-fold enters at the top of the funnel and is multiplied through every stage below it. And nobody questions the stages, because the rate was produced to win the bid, not to be true, and no one was asked to check it.

The gaps between teams

2 hrsOF RECRUITMENT LEADERSHIP A WEEK

On the large studies we have seen, that is roughly what the most senior person whose job includes recruitment gives it, between the other things the role carries. And what they look at is the top of the funnel: leads, ads, sites opened.

Below that, the know-how for getting a patient from a phone call to a chair sits with the call center, the coordinator and the ad agency. Three organizations, three contracts. The handoffs between them belong to nobody. So a referral sits on a desk for a week, and it is nobody's fault, and it is the study's patient.

Trial management is built to monitor conduct, not to improve it.

ONE SYSTEM

The same four disciplines, applied since 2012.

We own the funnel alongside you and your CRO, and we run it on one system. The know-how is fifty years old between us. The system that carries it has run on every study since 2012, so the result does not depend on who happens to be in the room.

THE ENROLLMENT ENGINEERING SYSTEM

Four disciplines. One enrollment system.

01

Modeling

Everyone models the top of the funnel: how many patients need to be contacted. We model every stage, for every site, and revisit the assumptions continuously as new information surfaces. We then use our solutions library to identify which action is most likely to move the number next.

Before you sign off the protocol or the site list, you can see what each decision could cost in enrolled patients, and which input levers matter most. Because a small change at the bottom of the funnel compounds all the way back to the top.

02

Behavioral science

Behavioral science helps us understand how different people make decisions when time, attention and information are limited. It is not a one-size-fits-all set of nudges: patients, investigators and coordinators weigh different things in different circumstances. We use those insights to design a patient journey and site delivery model that work across those variations. The result: more qualified patients say yes and stay, while coordinators are more likely to prioritize your study when five others are competing for their attention.

03

Operational design

Your enrollment strategy has to work inside real clinics and healthcare systems. Before activation, we test the planned patient and site workflows against how care is actually delivered, identifying the constraints that could slow or distort execution. Because we have led delivery from the site, CRO and sponsor sides, we know where plans are most likely to collide with operational reality, and how to address those conflicts before they become enrollment problems.

04

Live control

Enrollment management is different from conventional trial management. Trial management monitors whether the study is being conducted correctly. We manage whether qualified patients are moving through each stage of enrollment and, when they are not, find out exactly where and why.

Our weekly reporting surfaces problems where they begin: in a site workflow, an advertising campaign or a referral pathway. Each problem is given a named owner, a corrective action and a deadline, and we stay with it through delivery. That allows the study to correct course within weeks instead of waiting for the problem to appear as a quarterly trend. We also maintain the site, vendor and referral relationships needed to make those corrections work.

The loop. What Live control finds goes back into Modeling and Operational design, weekly.

01 Modeling02 Behavioral science03 Operational design04 Live controlweeklyweekly01 Modeling02 Behavioral science03 Operational design04 Live controlweeklyweekly

Most trials have a recruitment plan. Almost none have an enrollment strategy, or a system to manage it.

SAME PATIENTS. SAME SITES. SAME SPEND.

Small changes. Compounding impact.

This sample conversion funnel shows how small improvements at the right points can unlock enrollment. The answer is rarely one generalized hammer. It is finding the constraints that matter and making targeted changes where they will have the greatest effect.

To demonstrate the compounding effect, this illustrative model starts from the baseline rates of an example study and applies a 5% relative improvement at each of ten stages. The result is a 39% reduction in the number of patients needed at the top of the funnel to achieve the same number of retained patients.

Try it yourself. Drag any slider to improve a stage and see how the change affects the number of patients required at the top of the funnel. The red figure shows how many additional patients the baseline conversion rates require compared with your revised model.

Start with baseline rates

Drag the circles to improve a stage. Each slider runs from 0% to 100%, with the baseline rate marked on the track. You can also use the arrow keys.

40%
50%
60%
50%
60%
70%
70%
85%
55%
85%

EVERY ENGAGEMENT IS LED BY KYM OR LIAM

Does your study qualify?

  1. If it qualifies, a diagnostic assessment with Kym or Liam. Sixty minutes. Free. Not a sales call. You leave with a diagnosis and a recommendation, and if we're not the right answer, we say so.
  2. Then, if you're right for us and we're right for you, a selection of services.
Free Assessment

Free 1-hour enrollment assessment, delivered by one of our principals